

AI visibility measurement tracks how a brand appears in a predefined answer sample. It separately records mentions, website citations, recommendations, information accuracy and business outcomes that can be connected to a visit.
If I could choose one thing in a GEO report, it would be an explanation of how a number was produced. “Visibility is 40%” without questions, sample details and calculation rules does not give me enough to decide what comes next.
I recommend a small system you can repeat consistently. Its purpose is to identify the next work and recognise insufficient data.
Measurement matters when connected to concrete changes. For tasks and responsibilities, see the company optimisation guide for ChatGPT search.
What are we actually measuring?
Each metric should answer one question. I would structure a basic report as follows:
| Metric | Recording rule | Interpretation limit |
|---|---|---|
| Mention | The brand name appears in the answer | A mention need not be positive |
| Domain citation | The answer links to your domain as a source | A source is not automatically a recommended supplier |
| Recommendation | The brand is explicitly suggested for the described need | Applies to that answer and recorded conditions |
| Accuracy | The service, location and terms match verifiable information | Requires human content review |
| Website visit | Analytics recognises the relevant visit source | Does not capture every earlier brand exposure |
| Business outcome | An enquiry, qualification, booking or purchase is recorded | Channel attribution depends on available data |
The first four describe the answer sample. The last two connect visibility to visitor behaviour. I would retain both groups and clearly state when their connection cannot be confirmed.
How do you build a repeatable panel?
I suggest starting with twenty questions about one priority area. This is a practical initial scope, not a statistical standard or magic number.
Include understanding a problem, comparing solutions and choosing a supplier. Label branded questions separately. Save each question's exact wording and business reason.
An initial protocol might use three repetitions of each question per platform, in separate new conversations with settings as consistent as possible. Twenty questions times three repetitions gives sixty checks per platform. Two platforms mean 120 checks, but assess each platform separately first.
If the panel changes, create a new version and record the date. Retain some shared questions for comparison so a larger topic set does not look like sudden visibility growth or decline.
The AI visibility audit guide covers question selection and records for each attempt.
Calculating mention rate: an example
Mention rate is the number of valid answers mentioning the brand, divided by all valid answers in the same sample, times one hundred.
Illustrative example, not client results: a brand appears in eighteen of sixty valid answers on one platform. Its sample mention rate is 18 / 60 × 100 = 30%.
If nine answers include a source from your domain, the domain-citation answer rate is 15%. If six recommend the brand, the recommendation rate is 10% under that criterion.
One answer can belong to all three groups. Do not add the percentages. Multiple links to one domain in one answer do not become multiple cited answers.
Thirty percent does not mean thirty percent of buyers saw you. Repetitions of selected questions are not an independent market survey. The result describes system behaviour in the recorded test.
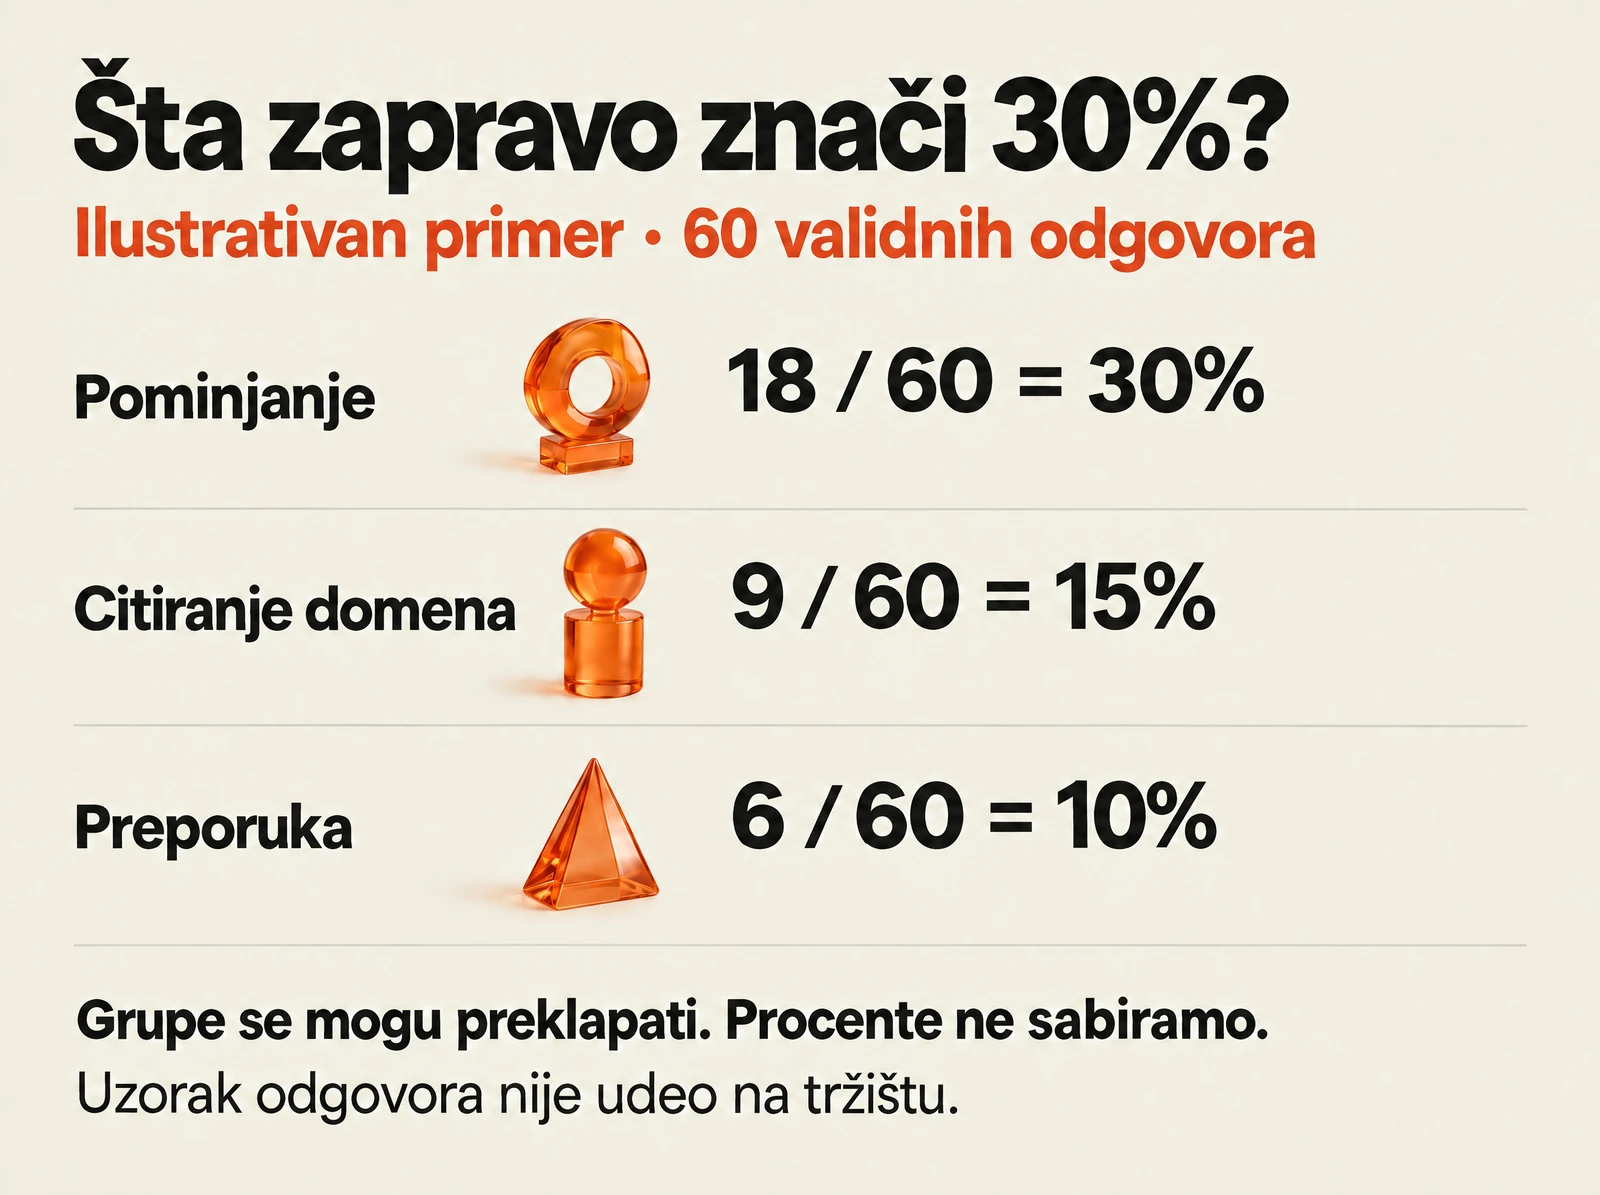
Text description of the graphic
- Observed sample: 60 valid answers from one platform.
- Mentions: 18 / 60 = 30%.
- Domain citations: 9 / 60 = 15%.
- Recommendations: 6 / 60 = 10%.
- An answer may belong to multiple groups. Do not add percentages. An answer sample is not market share.
What if a test fails or an answer cannot be used?
Label technical errors, interruptions and unsavable answers separately. Define retry rules before testing.
A technical failure differs from a valid answer without your brand. The latter must remain in the denominator. Otherwise, the report may show growth simply because unfavourable answers were removed.
Show planned attempts, valid answers, technical failures and retries in the summary. Every percentage needs its denominator.
How can AI visibility connect to enquiries?
Start with reliable records: analytics source, entry page, contact and later qualification. Asking “How did you first hear about us?” can add context technical measurement lacks.
Keep these sources separate. Someone may first hear of you through AI and later arrive through branded Google search. Self-reported source and the latest recorded visit describe different parts of the journey.
In GA4, check dimension scope too: first-user source and session source answer different questions. Google's traffic-source dimension documentation helps interpret them.
Google includes AI Overviews and AI Mode traffic in Search Console's overall Web search data. I would therefore not present it as a separate, pure GEO metric.
Our site further explains how to measure whether marketing brings customers and our marketing analytics work.
What decision should a monthly report support?
I suggest a short table: observation, possible reason, next check and proposed work.
If mentions grow but the service description stays inaccurate, prioritise information. If descriptions are correct and relevant visits arrive without enquiries, examine the offer and conversion journey. If mentions vary without a pattern, extend observation and check test conditions.
Model, search-access or source changes can affect answers. Timing alone does not prove our work caused a metric change.
What is the first step?
Before publishing ten more articles, define one service, a question panel and basic records. Save a baseline for later comparison.
For terminology, read the SEO, AEO and GEO comparison. To build a panel for your business, explore GEO and AI visibility and book a conversation.
My goal is for you to read the report and understand what changed, what remains unknown and why we are doing the next task.